- TLDR
- Introduction and problem statement
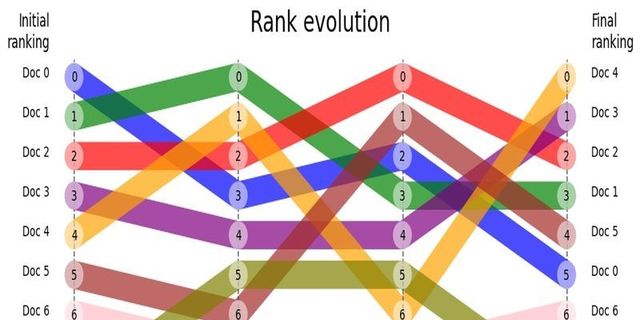
- Inspiration - Rank flow visualization
- Tracking the rank changes in your RAG
- Rank tracking using the structured logs
- How to track with struct logs?
- Rank tracking using callbacks
- How to track retriever data with callbacks?
- Visualization
- References
TLDR
This article discusses the importance of tracking and visualizing rank changes in Retrieval-Augmented Generation (RAG) systems. It introduces the concept of rank flow visualization, which helps analyze how document rankings evolve through different stages of retrieval and re-ranking. The article outlines methods for collecting rank data using structured logging and callbacks, and presents a Python library called 'rankflow' for creating visual representations of these rank changes. This visualization technique enables AI professionals to quickly identify patterns and optimize their RAG systems, ultimately improving the quality of information retrieval and generation.
Introduction and problem statement
Retrieval-Augmented Generation (RAG) systems are composed of two primary components: the retriever and the answer generator. The overall efficacy of RAG is largely contingent on the quality of the retriever, making it a critical area for optimization and analysis.
Advanced retrieval mechanisms often process numerous document fragments or nodes, which are initially ranked based on relevance. To enhance result quality, these nodes undergo multiple re-ranking phases, each aimed at surfacing the most pertinent information.
The re-ranking process can involve a variety of sophisticated techniques, including cross-encoders, bespoke re-ranking algorithms, and boosting systems. These methods serve to refine the rank of search results originating from diverse sources, such as traditional text search algorithms (e.g., BM25) and semantic search based on textual embeddings.
Tracking the evolving ranks of these document nodes across multiple processing stages within the retriever can be a complex and time-consuming endeavor. However, leveraging the human brain's innate capacity for visual information processing offers a solution. By employing appropriate visualization techniques, we can significantly streamline the analysis of node rank fluctuations throughout the various retriever stages.
This is where tools like rankflow chart (called also bump chart) come into play, offering a visual representation of rank changes that allows for rapid comprehension and insights into the retriever's performance. Such visualizations enable AI professionals to efficiently identify patterns, anomalies, and opportunities for optimization in their RAG systems, ultimately leading to more effective and reliable information retrieval.
In this article we focus on two aspects of visual analysis of rank changes: collecting data in retriever and generating graphical visualization like this:
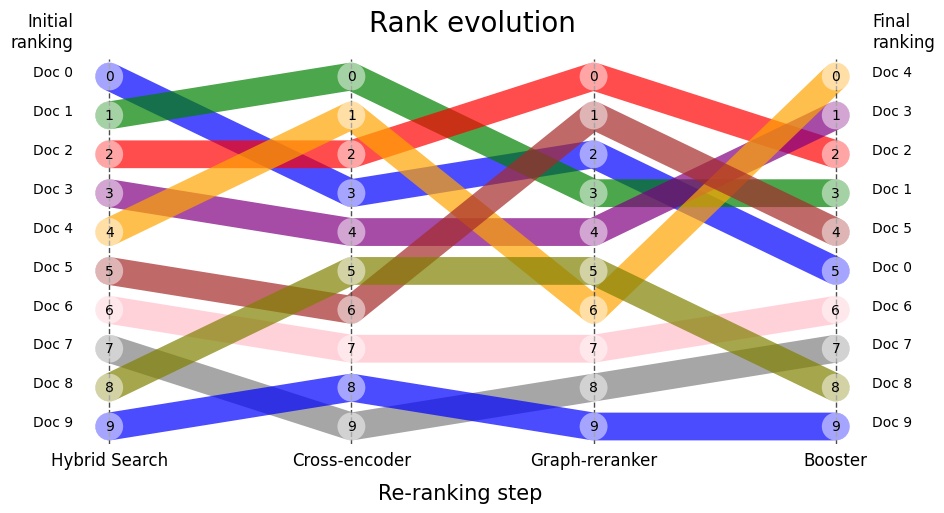
Figure 1: RankFlow chart illustrating rank changes in four steps of re-ranking. You can track the given node's rank history visually. For example, Document 4, after hybrid search, initially had a rank of 4. Then, after the Cross-encoder surfaced, it was re-ranked to 1. The Graph re-ranker subsequently placed it at rank 6, and finally, the Booster changed its rank to 0.
Inspiration - Rank flow visualization
When we started searching information about the tool that could help us to visualize how the ranks are changing, we found RankFlow that can do, more or less, the visualization type we were looking for.
|
You can create the Excel table that reflect rank of the documents on each step. Note that the RankFlow tool supports also column with values that is responsible for the width of the "ribbon". You can use it to e.g. visualize importance of given node, or how many information from this node was finally used in the generated answer (if you have this type of information at hand).
| Step_1 | val_1 | Step_2 | val_2 | Step_3 | val_3 | Step_4 | val_4 |
|---|---|---|---|---|---|---|---|
| doc_1_1 | 1 | doc_1_3 | 1 | doc_1_3 | 1 | doc_2_2 | 1 |
| doc_12_3 | 1 | doc_1_1 | 1 | doc_1_1 | 1 | doc_2_1 | 1 |
| doc_2_2 | 1 | doc_12_3 | 1 | doc_12_3 | 1 | doc_1_1 | 1 |
| doc_1_3 | 1 | doc_2_2 | 1 | doc_2_2 | 1 | doc_12_3 | 1 |
| doc_2_1 | 1 | doc_2_1 | 1 | doc_2_1 | 1 | doc_1_3 | 1 |
This tool was an appetiser to have something similar implemented in Python. Before going to visualization, let's spent some time on how to collect data required for this visual analysis.
Tracking the rank changes in your RAG
This is a separate topic - depending on the architecture of your retriever. I envision two main approaches:
- using structured logging
- using callbacks
- using dedicated monitoring/Open Source LLM Observability Tools and Platforms
Here, we will discuss only first two since they are pretty while skipping the specific observability tools.
Rank tracking using the structured logs
What are the struct logs? Structured logs are a standardized format for logging data where information is organized into consistent, machine-readable fields rather than free-form text. They typically use formats like JSON or key-value pairs, making it easier to parse, search, and analyze log data programmatically. The benefits of using structured logs include improved log consistency, easier data extraction and analysis, better integration with log management tools, and enhanced ability to generate insights and troubleshoot issues in complex systems.
How to track with struct logs?
Struct log have the advantage over non-structured log that you can easily, and with more confidentiality, extract data from it without using sophisticated log parsers. In Python, you can use loguru to drop the rank information to the separate log sink after each step that involves some form of reranking and trace e.g. node (chunk) id, new rank, and "label" for the reranking step. In this way you will get a jsonlines log file with all the data you need to create visualization. You can read more about how to use struct logs with loguru in loguru docs and this article.
Rank tracking using callbacks
What are the callbacks? Callbacks in programming are functions passed as arguments to other functions, which are then executed at specific points during the execution of the containing function. In the context of machine learning and deep learning frameworks, callbacks are often used to track and log various metrics, execute custom actions, or modify behavior during training or inference.
How to track retriever data with callbacks?
Here is an example how you can use callbacks to track re-ranking info in dummy implementation of the retriever with some re-ranking steps.
import json
from typing import List, Dict, Callable

class Document:
    def __init__(self, id: str, content: str, score: float = 0.0):
        self.id = id
        self.content = content
        self.score = score

class RankingTracker:
    def __init__(self, output_file: str):
        self.output_file = output_file
        self.rankings = []

    def log_ranking(self, step: str, documents: List[Document]):
        ranking = [{"id": doc.id, "score": doc.score} for doc in documents]
        self.rankings.append({"step": step, "ranking": ranking})

    def flush(self):
        with open(self.output_file, 'w') as f:
            json.dump(self.rankings, f, indent=2)

class Retriever:
    def get_relevant_documents(self, query: str) -> List[Document]:
        # Simulated retrieval
        return [
            Document("1", "Content 1", 0.8),
            Document("2", "Content 2", 0.7),
            Document("3", "Content 3", 0.6),
        ]

def cross_encoder_rerank(query: str, documents: List[Document]) -> List[Document]:
    # Simulated cross-encoder re-ranking
    for doc in documents:
        doc.score += 0.1  # Simulate score adjustment
    return sorted(documents, key=lambda x: x.score, reverse=True)

def custom_rerank(documents: List[Document]) -> List[Document]:
    # Simulated custom re-ranking
    for doc in documents:
        doc.score *= 1.2  # Simulate score adjustment
    return sorted(documents, key=lambda x: x.score, reverse=True)

def rag_retrieval(query: str, retriever: Retriever,
                  rerankers: List[Callable],
                  tracker: RankingTracker) -> List[Document]:
    # Initial retrieval
    docs = retriever.get_relevant_documents(query)
    tracker.log_ranking("initial_retrieval", docs)

    # Apply each re-ranker
    for i, reranker in enumerate(rerankers):
        docs = reranker(query, docs) if 'query' in reranker.__code__.co_varnames else reranker(docs)
        tracker.log_ranking(f"rerank_step_{i+1}", docs)

    return docs
In this code above:
- We define a simple
Documentclass to represent our documents. - The
RankingTrackerclass is responsible for logging rankings at each step and writing them to a file. - We have a basic
Retrieverclass that simulates initial document retrieval. - Two re-ranking functions are defined:
cross_encoder_rerankandcustom_rerank. These simulate different re-ranking strategies. - The
rag_retrievalfunction orchestrates the entire process:- It first retrieves documents using the retriever.
- Then it applies each re-ranker in sequence.
- After each step, it logs the current ranking using the tracker.
Here is the usage, with steps:
- Initialize the tracker and retriever.
- Call
rag_retrievalwith the query, retriever, list of re-rankers, and tracker. - Print the final rankings.
- Flush the tracked rankings to a file.
# Usage
if __name__ == "__main__":
    tracker = RankingTracker("ranking_results.json")
    retriever = Retriever()

    query = "What is the capital of France?"

    final_docs = rag_retrieval(
        query,
        retriever,
        [cross_encoder_rerank, custom_rerank],
        tracker
    )

    # Print final rankings
    print("Final document rankings:")
    for doc in final_docs:
        print(f"ID: {doc.id}, Score: {doc.score}")

    # Save all rankings to file
    tracker.flush()
Visualization
For the visualization part you can use small Python library rankflow (disclaimer: I'm the author) that is able to produce this type of visualization:
First, install it with pip:
pip install rankflow
It can accept various input data formats, one, convenient for data scientists is pandas data frame.
import pandas as pd
import matplotlib.pyplot as plt
from rankflow import RankFlow

data = {"Doc 1": [2, 1, 3, 2], "Doc 2": [1, 2, 1, 3], "Doc 3": [3, 3, 2, 1]}
df = pd.DataFrame(data, index=["Step_1", "Step_2", "Step_3", "Step_4"])
When the DataFrame is ready, then it is time to create RankFlow object and call plot() method.
rf = RankFlow(df=df)
rf.plot()

# save the plot to png
plt.savefig("rankflow.png")

plt.show()
If you found this library useful, please star the repo.
With plotting options you have also some alternatives that you can use or take inspiration to create you own, customized rankflow plot/bump chart. See the references for alternatives.