- Introduction
- Interpreting Kurtosis
- 1. Normal distribution
- 2. Flat distributions
- 3. Peaked distributions
- 4. Interpretation in context
- 5. Use caution in small samples
- 6. Compare with skewness
- When kurtosis can be misleading?
- 1. Outliers
- 2. Sample size
- 3. Non-normal distributions
- 4. Different distributions can have similar kurtosis
- Further reading
Introduction
Kurtosis is a statistical term that measures the shape of a distribution, specifically the degree of peakness or flatness in the tails of a distribution. A distribution with high kurtosis has a sharp peak and heavy tails, while a distribution with low kurtosis has a flatter peak and lighter tails.
The kurtosis of a distribution is defined as the fourth standardized moment, which can be expressed mathematically as:
where \(\mu_4\) is the fourth central moment (a measure of the spread of the data), and \(\sigma\) is the standard deviation of the data. The term "standardized" means that we divide the moment by the appropriate power of the standard deviation to make the kurtosis a dimensionless quantity. The subtraction of 3 is a convention that makes the kurtosis of the normal distribution equal to 0.
Kurtosis can be positive or negative, depending on the shape of the distribution. A positive kurtosis means that the tails of the distribution are heavier than the tails of the normal distribution, while a negative kurtosis means that the tails are lighter than the normal distribution. A kurtosis of 0 means that the distribution is perfectly normal.
Kurtosis is important in statistics because it can affect the interpretation of statistical analyses. For example, the presence of outliers or extreme values can cause a distribution to have high kurtosis, which can affect the results of some statistical tests. In addition, some statistical models assume that the distribution of the data is normal, so it is important to check the kurtosis of the data to see if this assumption is valid.
To better understand kurtosis, let's take a look at some examples. We'll start by generating some data from different distributions and calculating their kurtosis.
import numpy as np
from scipy.stats import kurtosis

# Generate data from a normal distribution
normal_data = np.random.normal(loc=0, scale=1, size=1000)
normal_kurtosis = kurtosis(normal_data)

# Generate data from a uniform distribution
uniform_data = np.random.uniform(low=-1, high=1, size=1000)
uniform_kurtosis = kurtosis(uniform_data)

# Generate data from a Laplace distribution
laplace_data = np.random.laplace(loc=0, scale=1/np.sqrt(2), size=1000)
laplace_kurtosis = kurtosis(laplace_data)
We generated data from three different distributions: a normal distribution, a uniform distribution, and a Laplace distribution. We then calculated the kurtosis of each distribution using the kurtosis function from the scipy.stats module.
Let's plot the histograms of the three distributions, along with their kurtosis values:
import matplotlib.pyplot as plt
plt.style.use('bmh')

fig, axs = plt.subplots(1, 3, figsize=(12, 4))

axs[0].hist(normal_data, bins=30)
axs[0].set_title(f"Normal kurtosis = {normal_kurtosis:.2f}")
axs[1].hist(uniform_data, bins=30)
axs[1].set_title(f"Uniform kurtosis = {uniform_kurtosis:.2f}")
axs[2].hist(laplace_data, bins=30)
axs[2].set_title(f"Laplace kurtosis = {laplace_kurtosis:.2f}")

plt.show()
This will generate a plot with three histograms, one for each of the three distributions, along with their kurtosis values.
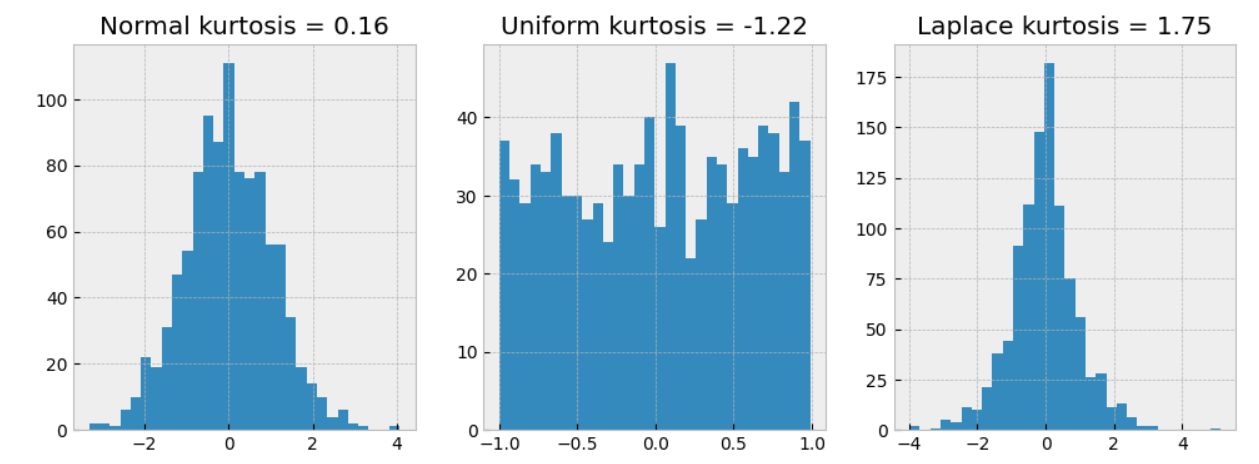 Figure 1. Kurtosis for: normal uniform and laplace distributions
As we can see, the normal distribution has a kurtosis close to 0, indicating that it is roughly normal. The uniform distribution has a negative kurtosis, indicating that it is flatter than the normal distribution. The Laplace distribution has a positive kurtosis, indicating that it has heavier tails than the normal distribution.
It's also worth noting that kurtosis is not the same as skewness, which measures the degree of asymmetry in a distribution. A distribution can have high kurtosis and be symmetric, or have low kurtosis and be skewed.
In summary:
Kurtosis is a statistical term that measures the shape of a distribution, specifically the degree of peakness or flatness in the tails of a distribution.>
A distribution with high kurtosis has a sharp peak and heavy tails, while a distribution with low kurtosis has a flatter peak and lighter tails. Kurtosis can be positive or negative, depending on the shape of the distribution, and it is important in statistics because it can affect the interpretation of statistical analyses. It's also important to note that kurtosis is not the same as skewness, which measures the degree of asymmetry in a distribution.
Interpreting Kurtosis
Interpreting kurtosis can be somewhat subjective, as the appropriate level of kurtosis can vary depending on the context and the goals of the analysis. However, there are some general guidelines that can be used to help interpret kurtosis in practical terms.
1. Normal distribution
A normal distribution has a kurtosis of 0. A distribution that deviates significantly from this value may be considered non-normal, although the degree of deviation that is considered significant will depend on the context.
2. Flat distributions
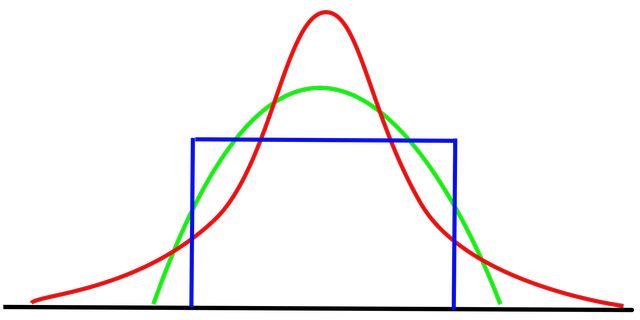
Distributions with low kurtosis values (less than 0) are relatively flat, meaning they have fewer extreme values than a normal distribution. These distributions are sometimes called "platykurtic". Examples of such distributions include the uniform distribution and the exponential distribution. In some cases, a platykurtic distribution may be desirable, as it can reduce the impact of outliers on statistical analyses.
3. Peaked distributions
Distributions with high kurtosis values (greater than 0) are relatively peaked, meaning they have more extreme values than a normal distribution. These distributions are sometimes called "leptokurtic". Examples of such distributions include the Laplace distribution and the Student's t-distribution. A leptokurtic distribution may be desirable in certain contexts, as it can increase the sensitivity of statistical analyses.
4. Interpretation in context
The interpretation of kurtosis should always be considered in the context of the specific analysis being performed. For example, in finance, a leptokurtic distribution may be desirable for modeling stock returns, as it can capture the possibility of extreme returns. On the other hand, in clinical trials, a platykurtic distribution may be desirable for modeling adverse events, as it can reduce the impact of rare and extreme events.
5. Use caution in small samples
Interpretation of kurtosis can be more difficult in small samples, as the kurtosis value may be influenced by a few extreme values. In such cases, it may be useful to examine the distribution visually or to perform a sensitivity analysis to assess the impact of extreme values on the results.
6. Compare with skewness
As mentioned earlier, kurtosis is not the same as skewness, which measures the degree of asymmetry in a distribution. In some cases, it may be useful to examine both kurtosis and skewness together to fully understand the shape of the distribution.
When kurtosis can be misleading?
Kurtosis is a statistical measure that describes the shape of a distribution. It provides information about the heaviness of the tails of the distribution and the presence of outliers. However, there are certain situations in which kurtosis can be misleading, and it is important to be aware of these.
1. Outliers
Kurtosis is sensitive to outliers. Outliers can distort the kurtosis value, making it difficult to interpret the shape of the distribution accurately. Therefore, it is important to inspect the data for outliers before calculating kurtosis.
2. Sample size
The sample size can also affect the kurtosis value. With a small sample size, kurtosis may not accurately reflect the shape of the population distribution.
3. Non-normal distributions
Kurtosis is only a useful measure for symmetric distributions. In the case of asymmetric distributions, kurtosis may not provide any useful information. For example, a distribution with a heavy tail on one side may have a kurtosis value that suggests a peaked distribution, which is misleading.
4. Different distributions can have similar kurtosis
Two different distributions can have the same kurtosis value. Therefore, kurtosis alone may not provide enough information to compare the shape of different distributions.
Further reading
- Kurtosis on Wikipedia
- Kurtosis: A Critical Review
- Understanding Boxplots (includes a section on kurtosis)
- Visualizing the Central Limit Theorem (includes a section on kurtosis)
- Misleading kurtosis | Andrey Akinshin
- Lowland multimodality detection | Andrey Akinshin
Credits:
Header image by Joxemai4 - Own work, CC BY-SA 3.0 wikimedia